Optimizing Financial Operations: How Dashboards Drive Efficiency
In today’s fast-paced business landscape, optimizing financial operations is crucial for organizations to thrive. The ability to streamline processes, gain real-time insights, and make data-driven decisions has become paramount. One powerful tool that enables businesses to achieve these goals is a dashboard. In this article, we will explore the significance of financial operations optimization and delve into how dashboards can drive efficiency in this domain.
Introduction
Efficient financial operations play a pivotal role in the success of any business. By effectively managing revenue, expenses, and cash flow, organizations can maintain stability, plan for growth, and make informed strategic choices. However, traditional manual methods of tracking and analyzing financial data can be time-consuming, prone to errors, and lack actionable insights. Dashboards are useful in this situation.
1. Importance of Financial Operations Optimization
Optimizing financial operations offers several benefits that contribute to the overall success of an organization. It allows businesses to identify areas of improvement, reduce costs, increase profitability, and maximize the efficient use of resources. Furthermore, streamlined financial operations instill confidence in stakeholders and help attract potential investors. By implementing effective optimization strategies, companies can position themselves for long-term growth and sustainability.
2. Understanding Dashboards
Dashboards are intuitive data visualization tools that provide a consolidated view of key metrics and performance indicators. They transform complex financial data into easily digestible charts, graphs, and tables, enabling stakeholders to grasp important information at a glance. Dashboards can be customized to display specific metrics relevant to the organization’s goals, making them an invaluable asset for financial operations management.
3. Key Metrics for Financial Operations
To optimize financial operations, it is essential to monitor and measure the right metrics. Here are some key areas to focus on:
Revenue and Sales
Tracking revenue and sales metrics is critical for assessing the financial health of a business. This includes monitoring sales growth, customer acquisition, customer retention, and average transaction value. By understanding these metrics, organizations can identify trends, spot opportunities, and optimize their sales strategies.
Expenses and Cost Management
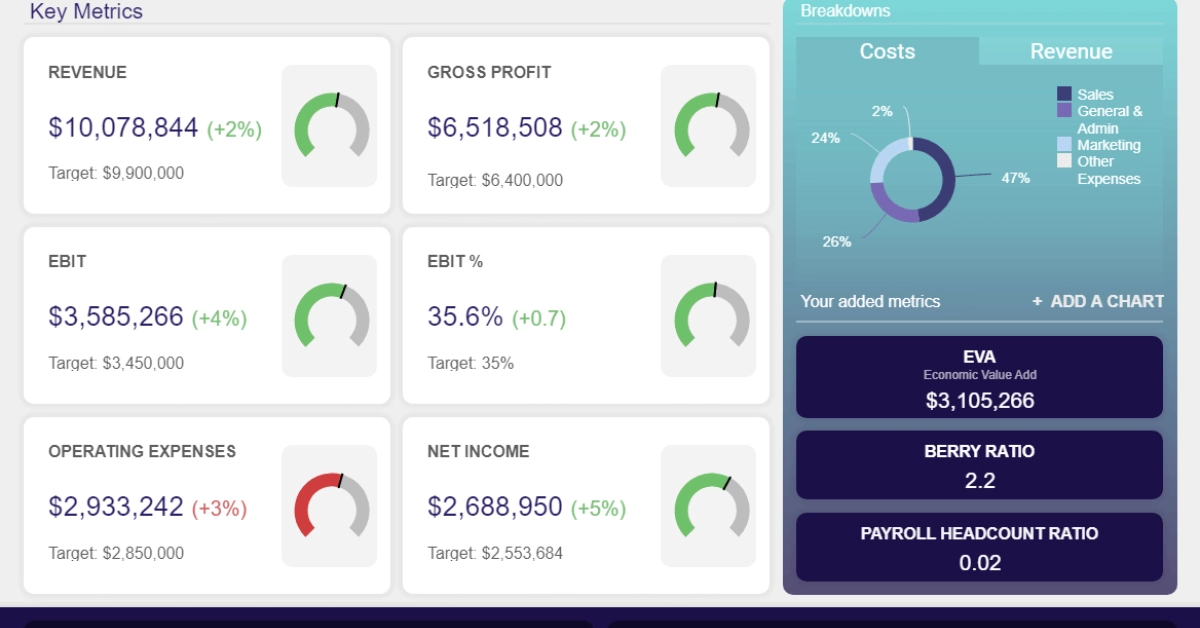
Managing expenses effectively is vital to maintain profitability. Dashboards can provide insights into various expense categories, such as payroll, marketing, operations, and supplies. By closely monitoring these metrics, organizations can identify areas where costs can be reduced, negotiate better deals with suppliers, and optimize their spending.
Cash Flow and Liquidity
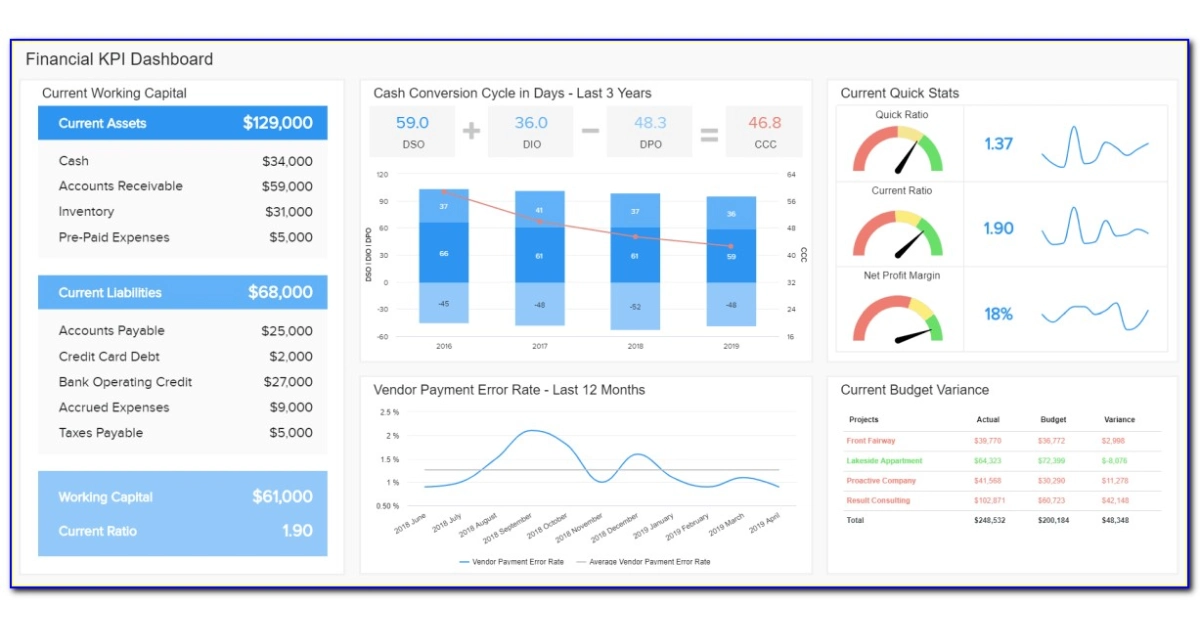
Management of cash flows is essential for a company’s long-term financial health. Dashboards can track cash inflows and outflows, highlight cash flow patterns, and provide visibility into liquidity ratios. By keeping a close eye on cash flow metrics, organizations can ensure they have sufficient working capital, plan for investments, and navigate potential cash crunches.
4. Benefits of Using Dashboards
Implementing dashboards for financial operations optimization brings numerous advantages:
Enhanced Visibility and Transparency
Dashboards provide a comprehensive view of financial data, fostering transparency and accountability across the organization. Decision-makers can access real-time information, track progress, and identify areas that require attention. This visibility promotes collaboration and ensures everyone is aligned with the organization’s financial goals.
Streamlined Decision-Making
Dashboards empower decision-makers with actionable insights. By visualizing key metrics, they can identify trends, patterns, and anomalies. This information enables them to make informed decisions quickly, respond to market changes, and take proactive measures to optimize financial operations.
Real-Time Monitoring and Alerts
With dashboards, financial operations can be monitored in real-time. Anomalies and discrepancies can be immediately detected, allowing organizations to take corrective actions promptly. Automated alerts and notifications can be set up to flag issues or deviations from predefined benchmarks, ensuring potential problems are addressed proactively.
5. Steps to Optimize Financial Operations
To leverage the power of dashboards for financial operations optimization, organizations should follow these steps:
Define Goals and Objectives
Clearly define the goals and objectives you want to achieve through financial operations optimization. This could include improving profitability, reducing expenses, enhancing cash flow, or increasing operational efficiency. Setting specific, measurable, achievable, relevant, and time-bound (SMART) goals will guide your optimization efforts.
Identify Key Metrics
Decide which important indicators best support your goals and objectives. This could include revenue growth rate, profit margin, cost-to-income ratio, accounts payable turnover, or days sales outstanding (DSO). Determine the metrics that provide the most meaningful insights into your financial operations and focus on tracking them through your dashboards.
Choose the Right Dashboard Solution
Evaluate and choose a dashboard solution that fits your organization’s needs. Consider factors such as ease of use, customization options, integration capabilities with existing financial systems, and scalability. Select a solution that provides the flexibility to create customized dashboards that cater to your specific requirements.
Customize Dashboards for Specific Needs
Tailor your dashboards to display the metrics and visualizations that are most relevant to your financial operations. Use charts, graphs, and tables to present data in a visually appealing and easily understandable format. Ensure the dashboard is user-friendly and provides the necessary information for effective decision-making.
Monitor, Analyze, and Adjust
Utilise the dashboards to often check the success of your financial processes. Determine trends, patterns, and opportunities for improvement by analysing the data. Make data-driven decisions, put required changes into place, and constantly improve your financial operations using these insights.
Conclusion
Optimizing financial operations is vital for businesses to thrive in today’s competitive landscape. Dashboards serve as invaluable tools for driving efficiency in this domain by providing real-time visibility, actionable insights, and streamlined decision-making. By embracing dashboard technology and following the outlined steps, organizations can enhance their financial performance, gain a competitive edge, and pave the way for sustainable growth.


